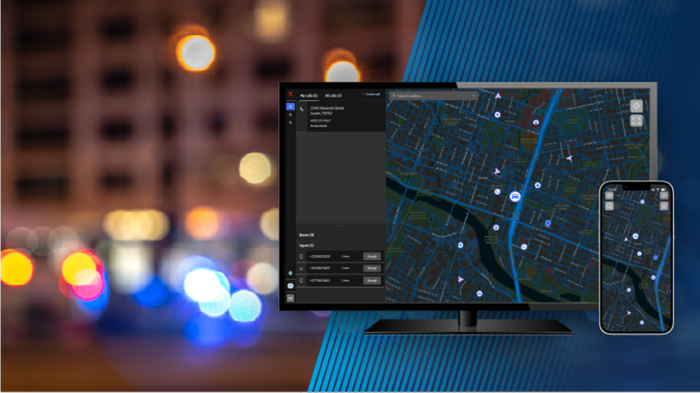
View from the Top

Is your National Broadband Plan funding at risk?

Potential inaccuracies in the federal government's National Broadband Map are not a trivial matter, because they could cost certain areas of the country vital funding.

Michael HiggsBy Michael Higgs

In 2009, Congress directed the FCC to develop a National Broadband Plan (the Plan) to ensure that every American has "access to broadband capability." Congress required that this plan include a detailed strategy for achieving affordability and maximizing use of broadband to advance various public interests. The resulting Plan was issued by the FCC on March 16, 2010, with implementation tasked to the FCC, NTIA, the executive branch, Congress, state and local governments, private industry, and non-profit organizations.

As part of its implementation of the Plan, the NTIA created and maintains the National Broadband Map (the Map). The Map is a tool to search, analyze and map broadband availability across the U.S. According to its website (www.broadbandmap.gov) the Map represents "an ongoing, collaborative data collection, review and revision process that involves the combined efforts of local, state and federal governments, broadband providers, private contractors, community anchor and academic institutions, and many community members across the country. Broadband providers voluntarily provided a majority of the data, which was subjected to evaluation at both the state and federal levels to maximize data accuracy, reliability and consistency." (emphasis added)

However, some have questioned the veracity and reliability of the data displayed on the Map. Brandon Presley, Northern District Commissioner for the Mississippi Public Service Commission, claims that the Map is "just plain wrong." He added that "their maps show that Mississippi is almost completely covered, and that is certainly not the case. Getting this corrected is a top priority, so that Mississippi can get its fair share of funding to cover these areas for residents and businesses."

Previous broadband penetration statistics provided by the FCC and NTIA also have come under fire. In a paper addressing this issue, Penn State professor Rob Frieden argued that "the FCC and NTIA have overstated broadband penetration and affordability by using an overly generous and unrealistic definition of what qualifies as broadband service, by using zip codes as the primary geographic unit of measure, by failing to require measurements of actual as opposed to theoretical bitrates, and by misinterpreting available statistics."

A great deal of federal assistance and grant funds rely on the ability of a community to fill in coverage gaps on the Map. The problem is that some stakeholders might have incentives that are not in line with the goal of creating an accurate Map. Where one company has a foothold in an underserved area, an exaggeration of its coverage capabilities might discourage investment in that market by potential competitors. Enhanced coverage maps also help sell one carrier's services over another's, but they do not help in the creation of a reliable Map. Municipalities hold more sway over single-entity monopoly providers than they do over competitive marketplaces.

All of the stakeholders have a vested interest in the Map, but they should be wary that their interests might not be in line with other parties helping to shape and create that Map.

What do you think? Tell us in the comment box below.

Michael Higgs is an attorney at Shulman Rogers Gandal Pordy & Ecker, where he practices in the wireless and infrastructure areas. He can be reached at mhiggs@shulmanrogers.com.

Discuss this Blog Entry 1

Brian Webster (not verified)
on Jan 3, 2013

Michael,
Before you use studies and quotes to support an position you should check your facts. From your article "Previous broadband penetration statistics provided by the FCC and NTIA also have come under fire. In a paper addressing this issue, Penn State professor Rob Frieden argued that "the FCC and NTIA have overstated broadband penetration and affordability by using an overly generous and unrealistic definition of what qualifies as broadband service, by using zip codes as the primary geographic unit of measure, by failing to require measurements of actual as opposed to theoretical bitrates, and by misinterpreting available statistics."

This paper they are quoting is either very old or the study is flat out incorrect. The unit of measure being the zip code has not been used in any study for at least 4 years that I can recall. Previous FCC studies of adoption and availability have used census tracts but the latest FCC report to Congress on Broadband availability used the National Broadband Map data and not the FCC form 477 information. That data is collected at the census block level (the smallest most granular unit of geographic measurement the census bureau has) for all wireline carriers or the actual coverage areas polygons for all wireless carriers. The latest FCC report to Congress can be found here http://www.fcc.gov/reports/eighth-broadband-progress-report. Furthermore the FCC has also published a list of census blocks that do not meet at least 3 meg down and 768K up as the minimum speed available by any carrier (satellite and mobile excluded). This data is also reported by census block and even goes so far as to list the blocks that are only partially covered. Here is a link to a map showing those areas http://www.fcc.gov/maps/unserved-fixed-broadband with the ability to also download the data table listing those blocks here http://data.fcc.gov/download/unserved_fixed_broadband/
unserved_fixed_broadband-master.zip. The National Broadband Map has gone through 6 revisions with the latest version to be published this month. It is certainly not perfect but it is getting beter with each 6 month revision cycle. Regarding the incentive for the stakeholders to overstate their coverage, they would only be hurting themselves because they would not be eligible to apply for the various programs they would typically use to help fund building those areas for service such as the new Connect America Fund. Any states having issue with the map can only point to themselves for their problems. They were the ones awarded the grant funding to develop the map on a state by state level. Most were awarded at least 4 million dollars to do so. Spending that money properly makes it very easy to develop the most accurate maps possible. Other states seem to be doing fine in that regard.

Post new comment
Sign In or register to use your Urgent Communications ID
(optional)
What's View from the Top?

Forward-looking perspectives from top leaders, regarding where our industry is today and, more importantly, where it is heading.

Blog Archive