Not as hard as it looksNot as hard as it looks
Despite their profound differences, it is possible to layer P25 and LTE systems, especially when an RF planning tool is employed.
January 1, 2012
With the advancement of land-mobile radio (LMR) and public-safety wireless technologies, there is a need to layer services onto common infrastructure in order to lower capital and operational expenses. One example would be to layer Long-Term Evolution (LTE) broadband services operating in the 700 MHz band onto new or existing Project 25–compliant digital radio systems operating on 700 MHz or 800 MHz airwaves.
Traditionally, P25 systems have utilized tall radio towers or rooftops because the need for coverage outweighs the need for capacity in most public-safety scenarios. In contrast, LTE networks typically require increased site density in order to meet additional capacity requirements. So, while there is a convergence in the network architectures, the sites are not necessarily identical and careful planning is required to minimize costs.
Link budgeting, antenna systems, tower heights and availability — as well as backhaul requirements — create a need for radio-frequency propagation software that can take these factors into consideration and support multiple design criteria within a harmonized platform. Some of the questions that should be considered are as follows:
What are the challenges and opportunities that arise with the advent of layered P25 and LTE systems?
What are the similarities and differences in how antennas are used in P25 and LTE systems?
How do RF planning tools help operators devise better P25/LTE networks?
What is the best method for comparing P25 and LTE site requirements?
The first thing to understand is that the RF link budgets associated with outdoor mobile-based P25 and LTE systems are quite different. The link budgets for P25 systems are based on received signal strengths, delivered audio quality (DAQ), and bit error rates (BER). In contrast, LTE systems are based on the achievable end-user connection data rates and system capacity as defined by a target service level agreement, or SLA. One key challenge then is to produce meaningful side-by-side comparisons of these two very different systems.
In order to accomplish this, the target data rate must be converted into a target carrier-to-noise ratio, which can be determined using the formula C/(N+I). At the cell edge of an LTE system that is delivering a target data rate of 100 kbps per user, this value is roughly 23 dB, which is greater than DAQ 4.0 — at this level speech is easily understandable with little noise or distortion. In contrast, typical P25 systems are designed for DAQ 3.4 at the cell edge — C/(N+I)= 17.7 dB — which means that speech is understandable but some noise or distortion is present.
As a point of reference, for every 3 dB difference in the link budget, the radiated power is cut in half. This leads to a substantial reduction in the coverage footprint per cell for LTE systems compared with P25 systems; as a result, the site count for an LTE system will be considerably higher. Indeed, on average, expect a 3 to 1 ratio between the LTE and the P25 site count, assuming a balanced uplink and downlink system. For data rates greater than 100 kbps (up to 500 kbps) at the cell edge, the disparity is even wider. Indeed, for an LTE system that delivers data rates at the cell edge of 500 kbps per user, the site ratio increases to 4 to 1 or more.
After reviewing the link budget differences and similarities, the next components to consider are the antennas. P25 systems typically use omnidirectional antennas that are mounted on radio towers, rooftops or water towers. In contrast, LTE sites typically use directional, or “sectorized,” antennas. The range of such antennas is limited compared with omnidirectional antennas, but they offer good signal consistency and data rates. To increase coverage area, sectorized antennas typically are clustered at a site, and usually are tilted to some degree in order to prevent interference with neighboring systems. Modeling of the antenna system is a key consideration in the evaluation of various system design scenarios.
The most effective way to make the RF link budget and antenna system comparisons in a real-world environment is to use radio-frequency planning software, as each deployment will differ based on local geographies, network topology, and the level of interference in the network.
When designing a layered P25 system, the first step is to perform drive-testing in order to assess the coverage of the baseline system and to provide input for the propagation model calibration. Since the measurements will be used for model calibration, it is important to follow best practices that will ensure the drive test is valid.
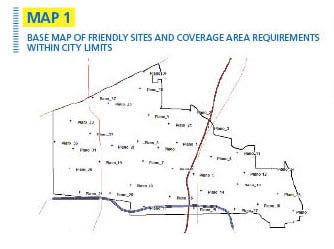
Model tuning is the process of taking the drive test data and modifying the propagation model parameters such that there is a good match for the environment and frequency in which the system is operating. This is a fundamental concept, as radio coverage estimates will be derived from the propagation models. The best approach to model tuning is to use the automated model tuning capabilities of the RF planning tool, because it removes all of the guesswork. (See Map 1.)
Depending on the approach taken for model tuning, it is common to have several models, based on the morphology (e.g., an urban model, a rural model and so on). This library of tuned models will be used during the network design and the comparison with the LTE overlay. For each site, a propagation model that best fits the environment must be assigned. This step requires an understanding of the local environment. Using the GIS component of the RF planning tool, it is possible to natively display Bing imagery and use this as a visual backdrop to help in determining the morphology of each site.
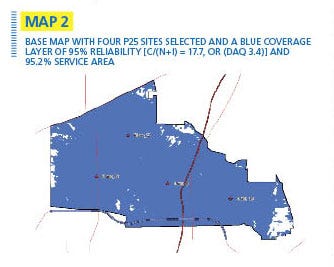
Once there is a high level of confidence in the RF planning tool’s ability to produce accurate predictions, the next step is to evaluate the sites. First, generate coverage maps with specific site data, tuned models and specific antenna patterns. At any point, it is possible to display the predictions for an individual site, a cluster of sites, or the entire network. Using the network analysis capabilities of the RF planning tool, it is possible to go beyond simple signal strength predictions and to delve into more advanced key performance indicators (KPIs), i.e., those that better reflect the network performance and the quality of the design.
Such advanced analytics take into consideration the system configuration (e.g., simulcast or multicast) of the P25 system and present coverage indicators such as BER, DAQ or C/(N+I). Throughout this process, the environment also is modeled in order to properly consider the impact of slow and fast fading on system performance, including system availability. (See Map 2.)
The next phase is to set up and analyze the 700 MHz LTE layer. Assuming a 500 kbps delivery per user on the LTE layer, a 4 to 1 ratio of LTE sites to P25 sites can be assumed initially.
Similar to the P25 baseline, sites can be prioritized. If the LTE system is using the same radio bands as the P25 system, the propagation models developed for the P25 system also can be used for the LTE layer. If a different frequency band is used (i.e., a difference in operating frequency greater than 20%), a new set of propagation models will be required in order to ensure that the LTE network is modeled with the same level of accuracy as the P25 system.
Once a propagation model is available, the starting point will be to reuse all P25 sites as LTE sites and analyze system coverage, which unquestionably will differ from the P25 system coverage due to the differences in the link budgets for the two systems and the way both systems handle interference.
Unique to LTE are the antenna patterns and the use of advanced antenna system (AAS) technologies such as MIMO (multiple input, multiple output). Various configurations are possible (2×2 and 4×4) and it is important to model such parameters correctly when the LTE coverage is assessed. As discussed earlier, the LTE coverage will be defined as a minimum connection data rate and there are many factors that impact that rate. Fortunately, the advanced modeling capabilities of RF planning tools make it possible to obtain a solid understanding of LTE system coverage.
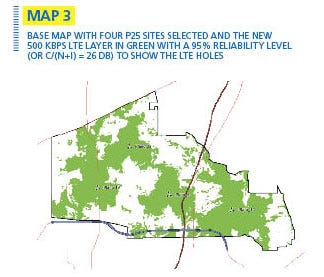
Now that P25 and LTE baseline networks have been modeled from a coverage perspective, it is possible to perform a side-by-side comparison using a common coverage KPI such as C/(N+I). A common coverage benchmark for a P25 system would be 17.7 dB, while 26 dB would be typical for an LTE system providing a data rate of 300-500 kbps per user at the cell edge. (See Map 3.)
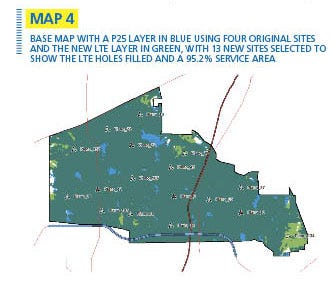
After finding a common comparison benchmark, it is possible to compare the coverage of the P25 and LTE systems. Using the GIS system and coverage statistics, the network engineer can locate the areas where there are holes between the two systems (i.e., where there is a lack of LTE system coverage). Locate the sites where there is no overlap and add LTE sites until the coverage matches the P25 system. Another approach is to use the automated site selection capability of the RF planning tool.
The engineer would define a list of candidate sites and a coverage target (e.g., 95% of the area must be covered), and the software automatically will determine the fewest number of sites required to achieve this goal. Whether this step is performed manually or automatically, the end result is an LTE network that boasts a higher cell density than the original P25 system, but which has the same coverage. (See Map 4.)
The RF planning tool’s backhaul design feature then can be used to optimize the backhaul connectivity required for the access network. The requirements for interconnection (i.e., the access network) will be loaded from the project created in the planning tool. This allows the backhaul engineers to take the tool’s site database and then use its topology design capabilities to develop a microwave backhaul configuration that will be optimal in terms of the number of links.
Of key interest in this process is the ability to generate an inter-visibility matrix that enables the engineer to understand what connections can be established. It is possible to use this matrix to automatically develop a backhaul layout that provides full connectivity to an insertion point (gateway).
Robert C. Shapiro, P.E., is an independent land-mobile-radio and wireless consultant serving the public safety, energy and telecommunications sectors for more than 25 years. He is based in Plano, Texas, and can be reached at [email protected].
Julius Catral, is a technical consultant for Mentum Wireless and has more than 30 years experience in the telecommunications industry. He is based in Plano, Texas, and can be reached at [email protected].
Bryan K. Jackson, is an independent consultant for Mentum Wireless and has more than 15 years experience in wireless network planning, design and optimization. He is based in Plano, Texas, and can be reached at [email protected].

