Cut your lossesCut your losses
FM theory can be used to predict how narrowbanding will affect system coverage.
April 1, 2010
In June 1995, the FCC adopted rules to “refarm” or “narrowband” private land-mobile radio frequencies below 512 MHz. To ensure more efficient use of this spectrum, the FCC mandated narrower channel spacings and established new limits on effective radiated power (ERP) and antenna height above average terrain (HAAT).
Narrowbanding is a spectrum-efficiency requirement that requires the equivalent of at least one user per 12.5 kHz for voice channels, and at least 9.6 kb/s per 12.5 kHz for data channels. Users can meet this requirement by one of several means:
Analog FM with reduced deviation on a 12.5 kHz-wide channel,
Digital Project 25 on a 12.5 kHz-wide channel, or
2-slot TDMA on a 25 kHz-wide channel.
Phase I Project 25 radios are designed to operate on 12.5 kHz-wide channels and are a good choice for narrowbanding for many reasons, but the FCC does not require the use of Project 25, nor does it require digital radios of any kind for narrowbanding.
The least cost and thus preferred solution for some users is to replace 25 kHz FM radios with 12.5 kHz FM radios. Manufacturers limit FM transmissions to 12.5 kHz primarily by limiting the FM deviation, and a factor of two reduction in deviation is considered sufficient to comply with the FCC emission mask.
FM improvement factor
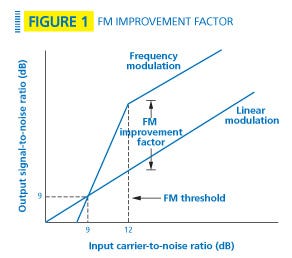
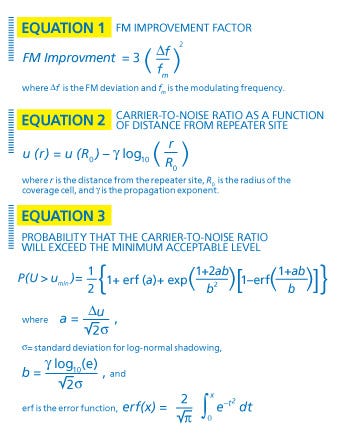
The bandwidth of an analog FM transmitter is largely determined by the modulation index, ß. Modulation index is the ratio of the peak frequency deviation to the maximum modulating frequency, ß = ?f /fm. Most land-mobile radios use wideband frequency modulation, meaning that the modulation index is greater than 0.5. Wideband FM is a nonlinear modulation technique that exhibits a threshold effect. As the input carrier-to-noise ratio to an FM detector increases — generally, above 9 dB — a corollary rapid increase in output signal-to-noise ratio occurs, to the point where the output signal-to-noise ratio actually is higher than the input carrier-to-noise ratio. This behavior continues to about 12 dB, where the maximum improvement is reached. This effect, also known as FM capture, is shown in Figure 1. The improvement in signal-to-noise ratio over linear modulation such as AM is called the FM improvement factor and is a function of the type of detector used. The FM improvement factor for a frequency discriminator is given by Equation 1.
FM narrowbanding and static coverage
The tricky part about applying the FM improvement factor to radio coverage is the service threshold. If the service threshold is 12 dB SINAD, the carrier-to-noise ratio (C/N) at the input to the FM detector is only 4 dB (for a 25 kHz-wide channel), which is well below capture, meaning that the FM improvement factor does not strictly apply.
According to Annex A of TSB-88.1-C, reducing the deviation by half increases the required C/N in this case from 4 dB to 7 dB. However, 12 dB SINAD corresponds to a delivered audio quality (DAQ) of 2.0, which is unsatisfactory for most users. For this reason, we will assume that the service threshold is above FM capture and that the loss in signal-to-noise ratio due to narrowbanding is simply 6 dB.
A reduction of 6 dB is a factor of 4 and assuming r-4 propagation, the effective radius of our repeater will be reduced by 4¼, or 1.4. Area is proportional to radius squared, so the loss in coverage is a factor of 2.0. In other words, the licensee must double the number of repeater sites to strictly maintain the original geographical coverage. If the propagation is better approximated by r-2, the coverage loss is a factor of 4.0 and the licensee must quadruple his repeater sites. These models are overly simplified and we will see shortly that, in practice, the situation is not quite this bad.
FM narrowbanding and fading channel coverage
To this point we have assumed a static channel with the user in a stationary position. In a mobile radio environment, random phase fluctuations cause an effect called random FM that destroys the FM improvement factor. In other words, wideband FM does not offer any signal-to-noise ratio improvement on a multipath fading channel. In fact, unless the FM deviation is very large, the output signal-to-noise ratio is actually less than the input C/N.
Despite the effects of random FM, the output signal-to-noise ratio in a mobile receiver still increases with increasing modulation index, following the 6 dB/octave behavior of Equation 1. Thus, more deviation is better, even on multipath fading channels, and the signal-to-noise reduction of 6 dB due to narrowbanding still applies.
A more sophisticated measure of geographical coverage
To this point, we have assumed it is necessary to recover all of the performance lost to reduced FM deviation. This approach requires construction of new repeater sites and may be cost-prohibitive. Instead, the licensee may be willing to live with somewhat degraded performance, provided the performance loss can be quantified. In the field, geographical coverage is not characterized by nice circles implied by the simplified analysis above. Even if we set a circular boundary for the service area, there are still holes inside the service area due to shadowing from terrain, foliage and manmade objects.
Given that shadowing will cause holes, an appropriate figure-of-merit for geographical coverage is the percentage of the repeater’s service area with a C/N that is above some defined threshold. To calculate this figure-of-merit, we first need to define the boundary of the repeater’s coverage area in terms of an acceptable carrier-to-noise ratio, umin. Let’s assume that today the repeater has a radius, R0, which results in acceptable service. For example, acceptable service may be defined as the condition where 90% of the locations inside R0 have an acceptable C/N. Now we make the following simplifying assumptions:
The mobile receiver’s location is uniformly distributed inside a circle of radius R0,
Co-channel interference is non-existent,
The C/N is log-normally distributed, with standard deviation s dB and mean u(r), which is a function of the distance r from the repeater site, and
The mean C/N drops off as ? dB per decade, depending on the distance from the repeater site. The mean C/N can be determined using Equation 2.
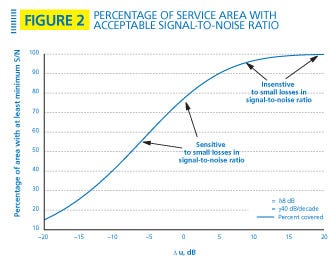
It will be convenient to define ?u, the mean carrier-to-noise ratio margin (in dB) at the edge of the coverage area, as u(R0)-umin. In other words, if the mean C/N at the edge of the area is 19 dB and the minimum acceptable C/N is 17 dB, then ?u = 2 dB. With these assumptions, we can use the derivation defined by D.O. Reudink to arrive at Equation 3, which is the expression for the probability that the C/N within the service area will be above the minimum acceptable level. Equation 3 is plotted in Figure 2 for a standard deviation of 8 dB and a propagation exponent of 40 dB/decade.
The important principle illustrated by Figure 2 is that loss in coverage is strongly dependent on how well the service area currently is covered. For example, if 90% of the service area is covered with an adequate signal-to-noise ratio today and the total loss in signal-to-noise ratio due to reduced deviation is 6 dB, then the coverage loss will be 26%. However, if 99% of the service area is adequately covered today, the coverage loss is only 4%.
Although many repeaters may be required to fully recover lost performance, most of the equipment cost will go toward covering the last few percent. Fewer repeaters may be satisfactory if some acceptable coverage percentage is achieved. The wisest course of action will depend on a good understanding of current performance.
An alternative approach to quantifying coverage loss is to predict coverage using computer propagation models that take into account digital terrain data. Two studies should be performed: one for a wideband channel threshold (e.g., -102 dBm) and a second for a narrowband channel with a 6 dB higher threshold.
If, after a thorough analysis, one or more new FM repeater sites are needed, the licensee should compare the cost of Project 25 digital radios and repeaters that operate on 12.5 kHz-wide channels with a fading channel service threshold that is 3-4 dB better than a wideband FM radio.
Narrowbanding and co-channel interference
In land-mobile radio, we can be certain that someone else also is using our frequency. We just hope he is far enough away that the co-channel interference is manageable. In practice, many systems encounter co-channel interference at levels that impair performance.
Without fading, we can reduce the effects of co-channel interference by increasing the modulation index, ß. In fact, the output signal-to-interference ratio improves as the cube of the modulation index. Conversely, if we reduce the modulation index of our system and the interfering system, the signal-to-interference ratio drops.
For example, if we reduce the peak deviation from 5 kHz to 2.5 kHz, the signal-to-interference ratio drops by a factor of 23, or 9 dB. In Rayleigh fading, random FM destroys this index-cubed effect and co-channel interference is nearly constant with modulation index. However, the index-cubed effect can be regained with antenna diversity.
Jay Jacobsmeyer is president of Pericle Communications Co., a consulting engineering firm located in Colorado Springs, Colo. He holds bachelor’s and master’s degrees in electrical engineering from Virginia Tech and Cornell University, respectively, and has more than 25 years experience as a radio-frequency engineer.
Related Stories

