Are we there yet?
On your usual route to work, vehicles are crawling at 20 mph. On a parallel road, though, drivers are zipping along. Wouldn’t it be nice to know all that before you get stuck in traffic?
These days, motorists in a long slice of the East Coast can base their driving decisions on real-time knowledge of local traffic conditions, thanks to a multi-state intelligent transportation systems (ITS) initiative. The Vehicle Probe Project uses data from global positioning system (GPS) devices installed on vehicles to calculate traffic speeds on Interstate 95 and nearby roadways. The pilot project covers a region that stretches from New Jersey to South Carolina.
The project’s sponsor is the I-95 Corridor Coalition, a partnership of transportation agencies, toll authorities and other organizations in states extending from Maine to Florida.
Transportation agencies have used in-pavement sensors, roadside radar, cameras and other instruments for many years to monitor traffic. Those technologies are good at detecting major slowdowns, but not at measuring ordinary traffic flow, said Bill Stoeckert, information and payment service coordinator for the I-95 Corridor Coalition. “They haven’t been proven to be a very useful tool for providing travel times.”
Nor do they come cheaply. “You have to go to the expense of designing and building and communicating with them, and then you also have to maintain those sensors,” said Rick Dye, systems administrator for the Coordinated Highways Action Response Team (CHART) program at the Maryland State Highway Administration (MSHA).
Federal, state and local transportation officials want to do more than merely report when an accident that forces traffic to a near-standstill occurs, Stoeckert said. They also want to tell drivers, under any conditions, how long it will take to drive from Point A to Point B.
The vehicle-probe technology gives coalition members that ability. “It’s mainly to supplement existing detection systems that they may already have, or provide additional detection and speed information that they don’t have on certain segments of their highways,” Stoeckert said.
To obtain the travel-time data, the coalition has contracted with Inrix, a Kirkland, Wash.-based vendor of traffic information. Inrix’s customers include commercial traffic-information services, government agencies and consumers.
Much of the data that Inrix employs to calculate traffic speeds comes from GPS devices installed on tractor-trailers, delivery vans, taxis, utility trucks and other fleet vehicles.
Inrix forms agreements with companies that sell automatic vehicle location (AVL) and fleet-management services to fleet owners, or it sometimes contracts with the owners themselves. As these companies collect data on location, speed and heading from the vehicles, they share that information with Inrix. The company also collects GPS data from other sources, including consumers who use its traffic-information application for the iPhone and, through an agreement with Ford, the SYNC onboard navigation system.
Using proprietary technology, Inrix processes the aggregated, anonymous data to calculate traffic speeds on specific road segments.
In some areas, Inrix adds data from transportation departments’ own roadway sensors to the mix. “Then we fill in all the gaps on the roads where sensors are supposed to be operating but they’re not, or where they don’t have sensors, period, to give a complete, integrated picture, updated every minute,” said Rick Schuman, Inrix’s vice president, public sector.
To calculate travel times for the I-95 Corridor Coalition, Inrix draws upon a broad, constantly changing mix of sources, Schuman said. “We have probably three to four times the amount of raw data going into this system than we did when we started the project a little less than two years ago.” Inrix also has improved its processing methodology, producing ever-more-accurate speed calculations, he said.
Since July 2008, the coalition has been purchasing traffic-speed data from Inrix for I-95 and adjoining highways in six states — 1,500 highway miles in all — running from New Jersey to North Carolina. New Jersey and North Carolina each added coverage on all limited-access highways within their borders. South Carolina joined the pilot in August 2009.
“As a result of North Carolina, New Jersey and South Carolina using the contract provisions for expansion, the total coverage is now 4,700 miles,” Stoeckert said. On top of that, Inrix is donating coverage on 1,000 miles of arterial roads, he said.
Funding for the Vehicle Probe Project comes from the program budget of the Coalition, which receives much of its support from the Federal Highway Administration (FHWA).
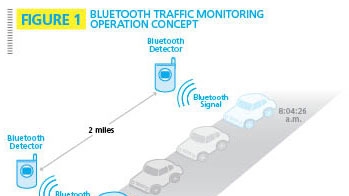
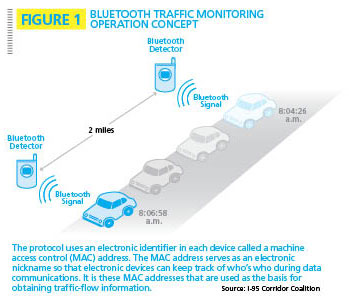
To make sure that the probe data is accurate, researchers at the University of Maryland have been conducting validation tests, using Bluetooth technology to measure travel times and comparing those with Inrix’s reported times.
The researchers use pairs of roadside detectors to capture signals from Bluetooth-equipped devices, such as hands-free cell phones, in cars as they pass. Those signals include anonymous Machine Access Control (MAC) addresses. The time it takes a MAC-address signal to pass from one detector to the next is the travel time on that section of roadway.
“After the data started coming in, in July of 2008, they did a validation of the whole system,” Stoeckert said. Measurements showed that the data was meeting the contract requirements. Since then, researchers have conducted monthly validations on selected highway segments. The validation data is a component of the payment formula that the coalition established with Inrix, he added.
Coalition members have been using the speed and travel-time data in several ways. Last year, for instance, the Virginia Department of Transportation (VDOT) installed five travel-information monitors at the Tyson’s Corner Center, a northern Virginia mall. The screens indicate how many minutes it would take under current conditions to drive from the mall to different points in the Washington, D.C. region — for example, to Rockville, Md., via I-495 and I-270, or to Reston, Va., via Route 7 and the Dulles Toll Road.
VDOT chose the mall because it’s near the Virginia Megaprojects, a series of large construction projects that create a good deal of congestion. Among other things, VDOT is building high occupancy/toll (HOT) lanes on portions of Interstates 95, 395 and 495.
“We figured this would be perfect in conjunction with those projects, to show people alternative routes,” said Scott Silva, ITS systems development manager for VDOT. Also, the agency can use the travel-time data to manage congestion around the construction. “If we see travel times slow down up there, or we see major congestion in the HOT lanes area, then they can close the work zones earlier and open more lanes to the public,” he said.
In addition, VDOT’s planning division is using the data to help identify road segments where traffic jams are common. These might benefit from new HOT lanes in the future, Silva said.
Along with the screens at Tyson’s Corner, VDOT posts travel-time information on electronic map displays at its welcome centers. Eventually, department officials hope to incorporate the data in Virginia’s Web- and phone-based 511 travel-information systems, Silva said. They also want to display travel times on dynamic message signs (DMS) on some of the state’s highways.
When the time comes to start programming those signs, VDOT will need to look only a few miles to the north for a model. Maryland already is using the data to feed its own DMS displays
Maryland’s CHART program originally installed DMS to warn drivers about accidents or other incidents ahead. When traffic was flowing normally, the signs stayed blank. Eventually, however, transportation officials wanted to be able to tell drivers heading south on I-95, for example, that it would take 10 minutes to reach the junction with the Capital Beltway. The signs would change in real time as traffic slowed or sped up.
Although roadway sensors are costly, CHART officials expected to use them to measure traffic speeds in order to provide such information to drivers, Dye said. “Our plan was that sometime by 2012 or 2013, we would build up enough of these sensors that we would be able to do travel times somewhere within the state.”
But thanks to traffic data from the Vehicle Probe Project, CHART launched its travel-information service two or three years earlier than planned — and without new traffic detectors.
This January, MSHA started displaying travel times on I-95 between the Baltimore and Capital Beltways. In March, it added messages on both beltways and on the Baltimore/Washington Parkway. In all, 23 signs are telling motorists how long it will take from their current locations to reach major junctions.
When needed, the signs still display incident alerts. As soon as an accident clears, the signs default to displaying travel times.
“It’s a way to get more use out of the signs, since they’re blank a lot of the time, as well as give the public some usable information to start making decisions,” Dye said.
Like VDOT, MSHA also plans to use the immense storehouse of travel-time data it’s accumulating to help with transportation planning, Dye said. “Our engineers who are planners are just foaming at the mouth to be able to use this data.”
Related Stories
- BelAir introduces mesh node for public safety, intelligent transportation
- Path to safer roads takes positive turn: Bidirectional vehicle communications
| Congestion Digestion | |
|---|---|
| Partners | I-95 Corridor Coalition, Inrix, University of Maryland |
| Participating states | New Jersey, Pennsylvania, Delaware, Maryland, Virginia, North Carolina, South Carolina |
| Duration of pilot | July 2008 – June 2011 |
| Miles covered | 4,700 miles of limited access highway, 1,000 miles of arterial highway |
| Primary data source | GPS devices installed on commercial fleet vehicles |
| Validation | 11,000 hours of data validated as of December 2009 |
| Source: Vehicle Probe Project | |